

Key Takeaways from the Forecasts:
According to estimates, by the end of 2026, the average price of Ethereum could be around $6,731.38.
In 2029, ETH prices are expected to fluctuate between $14,235 and $16,711, with an average of $15,473.
By 2032, the asset’s value could reach $16,519–$18,331, with the average price settling at $17,425.
Ethereum has been operating as a decentralized system since 2015, allowing developers to create smart contracts and dApps directly on the blockchain. This eliminates unnecessary intermediaries and makes the network more secure. The technology is open to everyone and focuses on scalability, data protection, and programmability, which helps create reliable digital solutions. Investors are attracted by the native token, ether ($ETH), and the capabilities of smart contracts, while developers are actively using them to build the decentralized finance (DeFi) ecosystem. For traders, all these factors also make trading Ethereum more straightforward and accessible.
What opportunities await investors and traders in the near future? Is there potential for $ETH to rise, and how much will it be worth in 5 years?
To find out, let’s take a look at detailed forecasts for the period from 2026 to 2032.
Overview
Cryptocurrency type: blockchain
Ticker: $ETH
Current price: $2,059
Market Cap: $251.7B
Daily Trading Volume: $14.19B
Circulating Supply: 120.7M
All-Time High: $4,891 (November 16, 2021)
All-time low: $0.4209 (October 22, 2015)
Daily high: $2,115.57
Daily low: $2,005.43
Technical Analysis of $ETH
Price Forecast Indicator: Value
Volatility: 4.12% (Moderate)
50-day SMA: $2,470.90 (SELL)
200-day SMA: $2,153.38 (SELL)
Market Sentiment: Bearish
Fear and Greed Index: 32 (Fear)
Positive Days: 15/30 (50%)
Ethereum ($ETH) Price Analysis
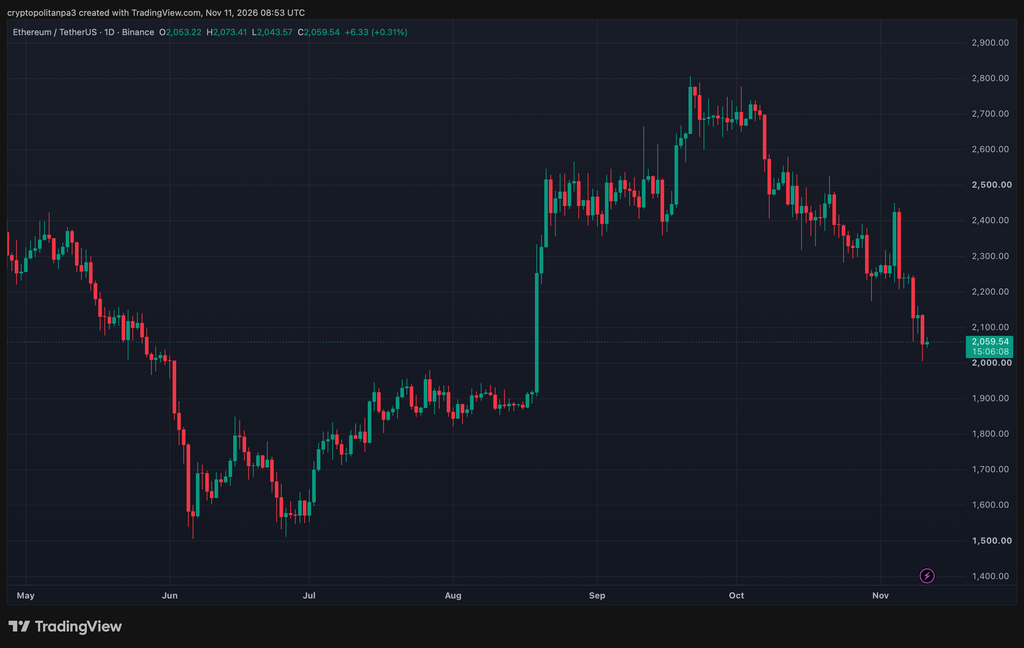
Currently, the price of ETH is fluctuating between $2,058 and $2,060, with daily volatility at a minimum. The asset is holding above $2,000 after breaking through the October 30 low ($2,175) and showing a local rebound around $2,005.
Key support levels are in the $2,000–$2,040 and $1,900–$1,950 ranges. Resistance can be found at $2,100–$2,130 and $2,175–$2,240. If the daily candle closes below $2,000, the price could drop to $1,900. On the other hand, if the price manages to break above the $2,175 level, market pressure will ease. For now, the current rally looks more like buying on a pullback near the $2,000 mark than the start of a full-fledged uptrend. The bearish sentiment is confirmed by the fact that local highs are consistently lower compared to the peak at the end of September (around $2,800).
Looking at the daily timeframe, the asset has gained only 0.31% to $2,060. Buyers are trying to keep the price above $2,000 after breaking through the low on October 30. The ETH/USDT pair is trading at $2,059.54. After a sharp drop below $2,175, the market has paused in anticipation. There has been a steady decline from the September high of $2,800; even the rally to $2,440 that occurred on November 4 has been completely erased.
The candle’s wick near $2,005 indicates that buyers are trying to defend the $2,000 level. The nearest support levels are in the $2,000–$2,040 and $1,900–$1,950 ranges (the upper limit of the August trading range). Resistance is currently in the $2,130–$2,175 range, and another significant barrier lies above $2,240. If the day closes below $2,000, we could see a drop to $1,900. On the other hand, if the price breaks above $2,175, pressure on the market will ease significantly. But for now, the overall sentiment remains negative.
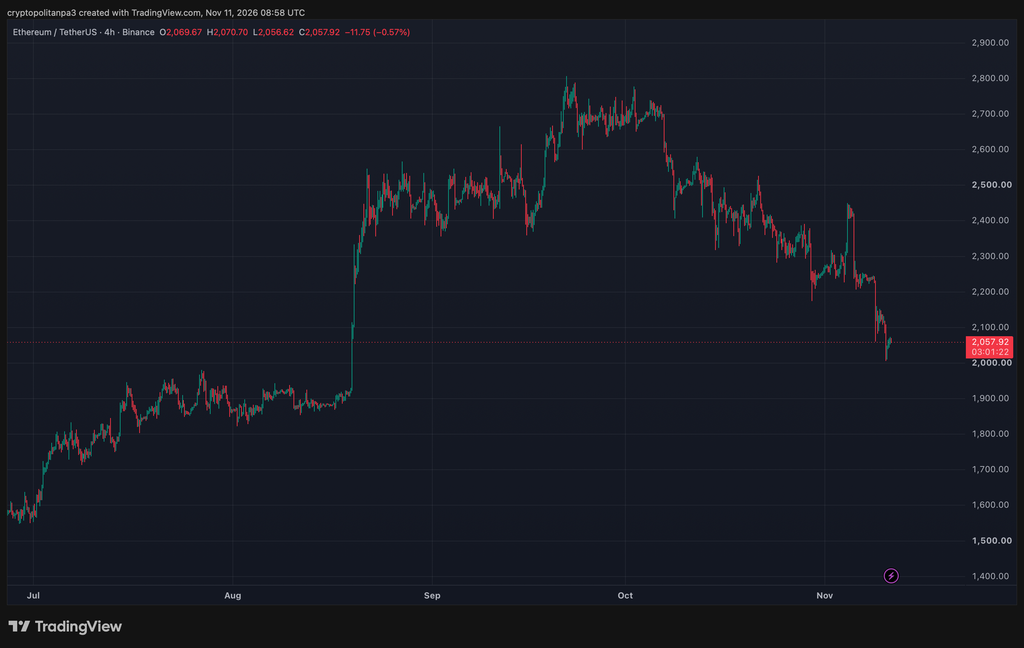
Let’s analyze ETH on the 4-hour chart. The price has fallen by 0.57% to $2.058, with the market attempting to hold above the $2,000 mark after breaking through the October low. The ETH/USDT pair is currently trading at $2.05792, following a sharp downward move after breaking through the $2.175 level. The chart clearly shows a downtrend that began at $2,800, and even the rebound on November 4 to $2,440 failed to change the overall picture.
The price had already approached $2,005 before a slight rise, so the $2,000 level appears to be an important area of interest for buyers. Support is expected in the $2,000–$2,020 and $1,900–$1,950 ranges. Resistance, meanwhile, is concentrated at the $2,100–$2,130 and $2,175–$2,240 levels. If the price falls below 2,000, it is quite possible to see 1,900. To reverse the negative trend, the price needs to rise above 2,175. Overall, bears are dominating the market.
ETH Technical Indicators: Levels and Signals
Daily Simple Moving Average (SMA)
Period | Value ($) | Action
SMA 3 | 2,163.89 | SELL
SMA 5 | 2,192.10 | SELL
SMA 10 | 2,244.11 | SELL
SMA 21 | 2,301.35 | SELL
SMA 50 | 2,470.90 | SELL
SMA 100 | 2,372.17 | SELL
SMA 200 | 2,153.38 | SELL
Daily Exponential Moving Average (EMA)
Period | Value ($) | Action
EMA 3 | 2,159.14 | SELL
EMA 5 | 2,187.60 | SELL
EMA 10 | 2,230.57 | SELL
EMA 21 | 2,294.21 | SELL
EMA 50 | 2,369.23 | SELL
EMA 100 | 2,336.05 | SELL
EMA 200 | 2,343.69 | SELL
What will happen to the price of ETH next?
Judging by the numbers, after breaking through the 2,175 level (the low from October 30), ETH will most likely soon test support in the $2,000–2,020 range. The fact that there is a wick around 2,005 on the chart indicates that buyers are trying to defend the 2,000 level. If they manage to hold it, a corrective rally to 2,100–2,130 is possible. At the same time, the former support level of 2,175 has now become resistance, which could trigger new selling pressure. If the daily candle closes below 2,000, the asset could drop to 1,900–1,950, which is close to August’s prices. To shift from a bearish to a bullish trend, the price needs to rise above 2,240. So far, the outlook remains quite pessimistic.
Why is Ethereum rising today?
In fact, ETH’s gain today is quite modest. On the daily chart, we see a 0.31% increase at a price of 2,059.54, while the latest 4-hour candle shows a 0.57% decline. There are no obvious reasons for the rise, so this is more of a technical analysis. The slight increase looks like a typical bounce after the price fell below the October 30 low and touched the 2,005 mark. Buyers have become active around the 2,000 level, which is significant from both a technical and psychological standpoint. This triggered a slight rise, but the momentum is fading, so this is more likely a temporary halt to the decline rather than a full-fledged recovery.
Should you buy ETH now?
Ethereum remains the main hub for DeFi in the crypto world, with a vast ecosystem of layer-2 solutions. Constant blockchain updates make it a favorite among Web3 developers. The ETH token has great potential, and expectations surrounding an ETF are attracting many traders. To understand the long-term outlook, it’s best to review our forecasts. But remember that this is not financial advice, and you should conduct your own analysis before buying.
What will the actual value of Ethereum be in 2026?
There is speculation that Ethereum could reach a peak of $7,216.04 in 2026.
What will the price of 1 Ethereum be in 2030?
Forecasts indicate that by 2030, the price of one ETH could reach $9,130.46.
What is the maximum growth ETH could see?
The price of Ethereum is influenced
by many factors: the state of the overall market, capital inflows from large institutional investors, protocol updates, and macroeconomics. In the next bull cycle, it’s entirely possible to see a range of $5,000–$7,000 if demand increases and Layer 2 solutions become even more popular.
If institutional investors show serious interest, ETH could surpass the $10,000 mark in the long term, provided it maintains its leadership among smart contract platforms. But don’t forget about volatility and potential pullbacks. The price may also be influenced by regulatory clarity and the transition to Proof-of-Stake.
Can ETH reach $10,000? According to forecasts, Ethereum is unlikely to exceed the $10,000 mark by 2028, and its peak value could be around $8,083.
Can ETH reach $25,000?
If the analysis is to be believed, the likelihood that Ethereum will break through the $25,000 mark by 2031 is quite low. Most likely, by that time, the maximum price will be around $11,334. Such an optimistic scenario is possible only if the network continues to develop, remains secure, and gains popularity. However, given how volatile the crypto market is, any long-term forecasts should be viewed with a certain degree of skepticism.
Is there a chance it could reach $40,000?
Our analysis shows that Ethereum has the potential to reach $40,000, although the expected peak by 2032 is estimated to be more modest—approximately $18,421.
Does Ethereum have long-term prospects?
Interestingly, while many well-known altcoins are trading below their averages, ETH has remained above its average price over the past two years. This offers hope for a positive breakout. By 2032, the price of the ETH/USD pair could rise to $18,421, so holding the asset for the long term looks quite promising.
What are people saying about Ethereum right now?
Experts
recently gathered in Cambridge to discuss the development of cryptography resistant to quantum computing. This is extremely important, as the development of artificial intelligence is accelerating the emergence of threats to existing blockchain security protocols, which may prove vulnerable to quantum technologies.
Quantum technologies pose serious risks to conventional encryption methods, and advances in AI are only bringing us closer to the moment when these threats become a reality. That is why researchers in Cambridge are currently coordinating efforts to develop robust protection against quantum attacks.
Ethereum Price Forecasts for November 2026
It is
projected that in November 2026, the price of Ethereum will range from $2,277.69 to $2,693.82, with an average of $2,512.89.
Price
forecast for November 18, 2026: low of $2,277.69, average of $2,512.89, high of $2,693.82

Ethereum Price Forecast for 2026
Throughout 2026, the lower price limit could be around $6,246.72, while the upper limit could reach $7,216.04. The average price is expected to be $6,731.38.
Year | Low ($) | Average ($) | High ($)
2026 | 6,246.72 | 6,731.38 | 7,216.04
Forecasts for 2027–2032
Year | Low ($) | Average ($) | High ($)
2027 | 3,076.51 | 3,259.02 | 3,441.52
2028 | 7,183.61 | 7,577.65 | 7,971.68
2029 | 14,235 | 15,473 | 16,711
2030 | 8,073.33 | 8,625.35 | 9,177.38
2031 | 10,358 | 10,790 | 11,221
2032 | 16,519 | 17,425 | 18,331
What to expect in 2027?
In 2027, the minimum price could drop to $3,076.51, while the maximum will be $3,441.52. The average forecast is $3,259.02.
What to expect in 2028?
In 2028, the price of Ethereum could range from $7,183.61 to $7,971.68, with an average of $7,577.65. This growth is attributed to the active adoption of Layer-2 solutions, the development of DeFi at the institutional investor level, and the integration of blockchain into financial systems. By that time, ETH’s deflationary supply model could significantly stimulate demand.
What to expect in 2029?
Significant growth is expected in 2029: the minimum price could be $14,235, the average $15,473, and the maximum could reach $16,711. By this time, the technology will likely have become the standard in the corporate sector and finance.
What to expect in 2030?
In 2030, a slight decline is projected: the price could drop to $8,073.33, with the average price at $8,625.35 and peaks reaching $9,177.38.
What to expect in 2031?
By 2031, the lower limit could rise to $10,358, and the average price will be $10,790. The maximum potential of $11,221 indicates growing investor interest.
What to expect in 2032?
Based on technical analysis, the price of Ethereum should not fall below $16,519 in 2032. The average price is expected to be $17,425, and a potential rise could reach $18,331. This will result from the deep integration of ETH into digital identification systems and the global financial system.
Ethereum Price Forecast for 2026–2032
Market Value
Analysis: Expert
Opinions Organization | 2026 | 2027
DigitalCoin Price | $2,480.22 | $2,663.17
Coincodex | $2,345.22 | $2,597.93
Forecast from Cryptopolitan
According to Cryptopolitan, by the end of 2026, Ethereum will trade within a range of $4,043.78 to $5,772.83. And by 2032, the price could rise to $14,736.80.
Ethereum Price History
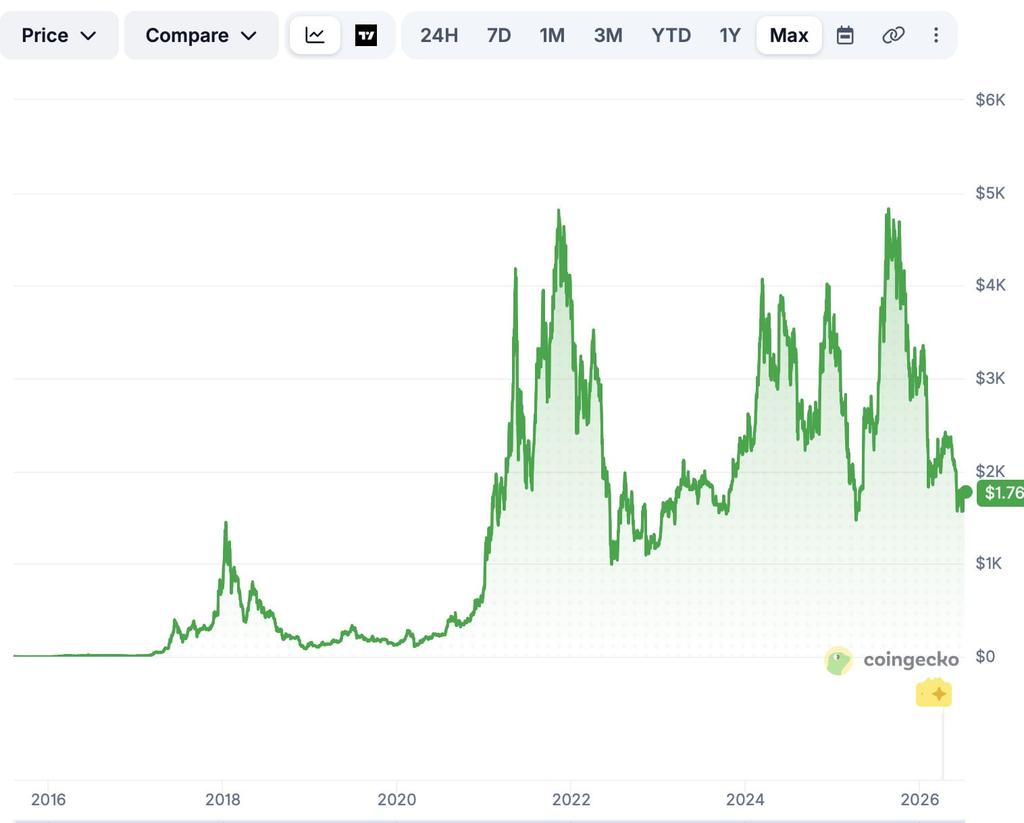
In 2016, Ethereum was just getting started at a price of $1.83. Later, the price rose to $14.48, but after the DAO hack, it fell back to $6.83 by the end of the year.
In 2017, riding the wave of the ICO boom, the price of ETH soared to $401.49, then fell to $157 and stabilized at $253.
In January 2018, ETH was trading at $1,000, but due to a market crisis, the price fell to $91 by the end of the year.In 2020–2021, the price of ETH showed strong growth, soaring from $130 to $4,293. However, 2021 ended at $3,679, and in 2022, the asset dropped significantly, falling to $1,196.
In 2023, Ethereum once again reached a peak of $3,739, ending the year at $3,349. Throughout 2025, the price of ETH fluctuated between $1,786 and $4,830, and in November, the price stabilized in the range of $3,700–$4,200.
From early November to early December 2025, the market experienced a pullback. After a steady rise to $3,590 around November 3, the price fell to a low of $2,745–$2,770 by November 21, clearly indicating a market weakness. By late November, the situation began to improve: by November 26–27, the asset had returned to the $3,015–$3,030 range. However, a slight pullback in early December caused the price to consolidate within the $2,950–$3,050 range by December 3.
On December 3, 2025, ETH prices ranged between $2,995 and $3,050. A gradual uptrend was observed throughout the month, with prices mostly fluctuating between $2,900 and $3,100. This indicated stabilization and that buyers were holding key levels. As of December 31, the asset was trading in the $2,970–$3,024 range. In the first two days of 2026, the price remained above $3,000, showing a moderate recovery amid balanced market sentiment.
Around January 3, 2026, Ethereum traded at levels of $3,120–$3,130, successfully holding the important psychological threshold of $3,000. However, by February 1, the price had fallen slightly and settled in the $2,900–$3,000 range. This was the result of a moderate downtrend in January, when sellers attempted to test support levels.
The situation changed dramatically in early February. On February 1, ETH was trading at $2,269.75, but by February 6, the price had plummeted to a low of $1,755.31. This was the steepest decline during the entire period under review. Following this volatility, an uptrend began in late February: on February 28, the price stood at $1,837.20, and by March 1, it had reached approximately $1,981.27, stabilizing just below $2,000.
Starting March 1, ETH traded around $2,200 and rose to $2,350, but then encountered significant resistance. From mid-March through April 2, there was a steady decline from $2,300 to $2,040–$2,060 due to selling pressure.
In April, ETH opened at around $2,040 but then surged to a monthly high of $2,450. Several factors contributed to this: a truce between the U.S. and Iran, an increase in staking at the Ethereum Foundation to 70,000 ETH, and the launch of spot ETH by Charles Schwab. However, after peaking, the asset lost 8% of its value, falling to $2,265 as of April 30. This was caused by $500 million in asset de-leveraging, which disrupted the upward trend. The month ended with a 22.8% decline compared to the start of the year.
On May 1, ETH opened at $2,308.85, gaining $43.83 for the day. This occurred amid accumulation by “whales” and expectations of the Glamsterdam update. But by June 1, the price had plummeted to $1,963.50, falling more than 14% since the beginning of May. The reasons were multifaceted: a steady outflow from ETFs, the formation of a “death cross,” and a break below the $2,000 support level. This confirmed that bears were dominating the market in early June.
Throughout June 2026, Ethereum continued to decline. Starting at $1,988, the price kept falling due to record outflows from ETFs, a 20% reduction in the Ethereum Foundation’s workforce, and macroeconomic issues. As a result, the price fell to a low of $1,512, closing the month at $1,558. This marked an unprecedented event—the third consecutive quarter of losses. The sell-off in June completely erased May’s brief consolidation. The price broke through all key levels, including the critical $1,600 mark, as spot ETFs saw net outflows and the number of active addresses nearly halved compared to February.
By July 5, the situation began to change: ETH rebounded from a low of $1,512 to $1,760. This was driven by “whale” activity, the launch of the new Ethereum Institutional fund on July 1, and a general improvement in sentiment. In the week leading up to the start of the month, the asset rose by 11.8%.
From July 5 to August 4, ETH fluctuated between $1,770 and $1,800, breaking through resistance at the 50-day EMA. This was followed by a steady rise to $1,857 as of July 21, when a bullish engulfing pattern confirmed the return of buyers. The recovery continued toward the $1,900–$1,950 range. The asset consolidated in the $1,900–$1,930 range, which appeared to be a steady rise following the June low.
From July through August, ETH showed strong momentum. After hitting a June low of $1,600, the price rose and stabilized in the $1,870–$1,950 range by mid-August. In the third week of August, a powerful breakout occurred: the price soared from $1,900 to a multi-month high of $2,565. This was a significant signal—the first higher high of the cycle and a break above the downtrend line that had been in place since August 2025.
From late August through September 4, a correction took place: ETH traded within the range of $2,377–$2,530, testing support at the Fibonacci level of $2,438. By September 4, the price had stabilized in the $2,453–$2,504 range.
In mid-September, ETH fluctuated within the $2,450–$2,500 range. In the second half of the week, the price rose to $2,660, but by September 16, it had fallen to $2,392 as investors began to reduce their risk exposure ahead of the Fed’s rate decision. However, from late September through October 6, the price of ETH rose again, climbing above $2,600. Around September 22, the asset peaked at $2,805 thanks to capital inflows into ETFs. Afterward, due to heavy selling, the price fell to $2,640, but by September 25, it had risen again to $2,690, and ahead of the Glamsterdam testnet fork, it stabilized around $2,730.
In early October, trading continued at around $2,700. During the first week, the price held just below the $2,800 resistance level, reaching $2,725 on October 5. However, on October 7, the price dropped by more than 4% and fell to $2,580. Then, on October 8 and 12, the market twice attempted to break through the $2,410 level but failed to do so. By mid-month, the situation appeared to have stabilized, and prices held steady around $2,507–$2,513.
In the second half of October, a downward trend emerged. Between October 20 and 27, the price fell by approximately 4.4%. This was due to about $220 million being withdrawn from U.S. spot ETFs, as well as the relocation of the Glamsterdam test to the Hoodi network. After the price reached a local low of $2,297, it rose to $2,354 on October 28. Since there is no precise data on the price at the beginning of November, the information as of November 5 remains unconfirmed.