

Earlier this week, Bitcoin was trading at $74,200. This is the lowest level since August, and compared to the peak values in October 2025, the price has fallen by 41%. The fifth week of decline has come to an end, and prices have come very close to the 200-day moving average. Let’s take a look at what exactly is weighing on the crypto market and what price levels to watch.
How the Price Is Changing
According to Binance, BTC is currently hovering around the $74,200 mark. Over the past 24 hours, the price has fallen by 2%, fluctuating between $73,510 and $76,200. Looking at longer time frames, according to CoinGecko, the asset has lost 5% over the past week, more than 10% over the past month, and 27% year-over-year. Since the beginning of 2026, the price has fallen by 15%: while the year began at $87,650, after peaking at $97,924 in mid-January, the asset dropped to a low of $57,800 in July.
For the past month and a half, the market has been trending downward. The peaks have been getting lower and lower: first $87,220, then $84,898, followed by $81,971, and finally $81,196 in early November. The same is true for the lows, which have been steadily declining, reaching $73,510 as of November 8.
Why the Sell-Off Is Happening
First, institutional investors have begun to exit their positions. The Block and SoSoValue report that approximately $1.28 billion was withdrawn from U.S. spot Bitcoin ETFs between November 2 and 6. This is the worst result since June, and outflows have continued for the second week in a row. The IBIT fund was hit the hardest, losing about $1.21 billion. Overall, since the beginning of 2026, net inflows into ETFs have turned negative and stand at approximately −$914 million.
Second, the Fed’s policy turned out to be tighter than many had expected. On October 28, the rate was left at 3.75–4.00%, but two committee members even advocated for a rate hike. The labor market also added fuel to the fire: 165,000 new jobs were created in October, significantly exceeding the forecast of 59,000. As a result, according to CME FedWatch, the probability of a rate hike in December now stands at about 77%. Against this backdrop, U.S. Treasury yields and the dollar index are rising, which is always bad news for risky assets such as cryptocurrencies.
Third, politics and regulation. Following the November 3 election, Democrats took control of both chambers of Congress. As Reuters reports, investors fear this will lead to tighter oversight of the crypto industry. The situation was further exacerbated by the Binance hack in late October, which resulted in losses exceeding $6 billion, although the company stated that it would cover the losses on its own.
Market Sentiment and Futures
The Fear and Greed
Index from alternative.me currently stands at 29 points, indicating clear fear in the market. At the same time, a peculiar situation is unfolding in the derivatives market: futures funding rates remain positive, while open interest hovers at $29.4 billion. Over the past 24 hours, positions worth $272 million were liquidated, and nearly all of this amount ($255 million) came from long positions.
Simply put, despite the decline, many traders are still trying to bet on a rally. This situation often leads to new waves of forced liquidations before the market finally finds its bottom.
Technical Picture
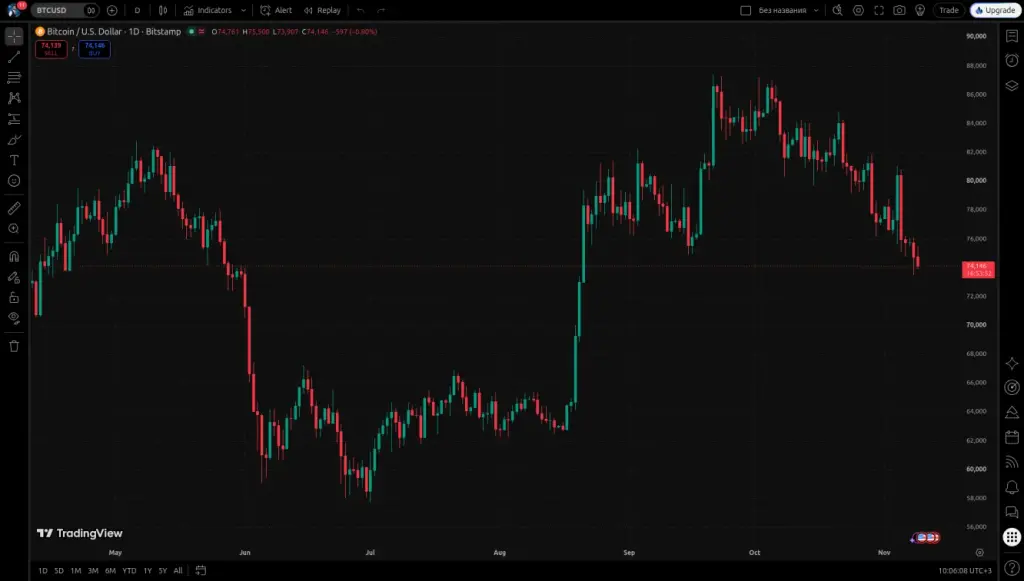
On the daily chart, the price is just 1.4% away from the 200-day moving average (around $73,200), which is currently moving almost horizontally. The 50-day moving average ($81,700) is falling, while the 100-day moving average stands at $77,460. The RSI indicator at 34 suggests oversold conditions, but there is no clear signal of a reversal yet.

According to wave theory, the current decline is a series of downward waves. There is speculation that the market is completing a downward impulse, but there are no clear signs yet that the correction has ended.
Key levels:
Resistance: $75,600, $76,200–$76,250, $77,400–$77,600, and $81,200.
Support: $74,000, $73,510 (November 8 low), the 200-day moving average zone ($73,200), as well as the $65,470 and $62,535 levels.
Possible Scenarios
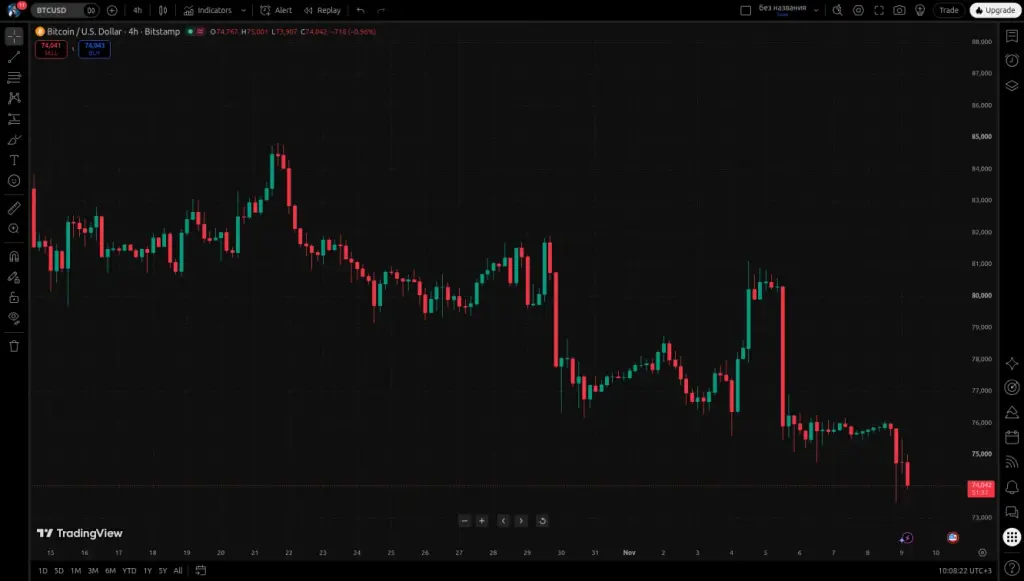
Base scenario: The price will test the $73,200–$73,500 zone. Since the 200-day moving average is located here, this will be a decisive battle between buyers and sellers. If the price consolidates above this level, a rebound is possible.
Optimistic scenario: a rise above $76,250. If Bitcoin consolidates above this level, the downtrend on the four-hour chart will be broken, and the price could rise to $77,400–$77,600 or even $81,200.
Pessimistic scenario: a daily close below $73,200. If the 200-day moving average is broken and outflows from ETFs continue, we could see a drop to $65,470 and even to the August low of $62,535.
The rebound scenario will be considered invalid if the price closes below $73,200. The bearish scenario will be invalidated if Bitcoin consolidates above $81,200.
How to Avoid Losing Money
When the market has been falling for a long time, the biggest mistake is trying to catch the bottom without using stop orders. In such a situation, it’s best to follow three rules: react to actual price movements in key zones, don’t invest all your capital in a single trade, and decide in advance under what conditions your strategy will no longer work. The main indicators in the near future will be fund flows into ETFs and statements from the Fed ahead of its December 8–9 meeting.